Showing posts with label music. Show all posts

Saturday, May 8, 2010

Frequency components of music


From Spectra and Pseudospectra; click for full size.

Measured eigenvalues in the complex plane of a minor third A4# carillon bell. The grid lines show the positions of the frequencies corresponding to a minor third chord at 456.8 Hz. together with two octaves above the fundamental and one below. Immediately after the bell is struck, the ear hears all seven of the frequencies portrayed; a little later, the higher four have decayed and mostly the lowest three are heard; still later, the lowest mode, the 'hum', dominates. The simple rational relationships among these frequencies would not hold for arbitrarily shaped bells, but are the result of generations of evolution in bell shapes to achieve a pleasing effect.

Seems like this format could make a nice interface for designing new sounds; someday I'd like to get around to recreating it.

Sunday, November 22, 2009

Delia Derbyshire, Alchemist of Sound


The amazing Delia Derbyshire, pioneer of British electronic music, demonstrating tape loops. A clip from the documentary "Alchemists of Sound" on the history of the BBC Radiophonics Workshop, where Derbyshire worked from 1962-1973.

Derbyshire is best known for her realization of the original Doctor Who theme-- from Wikipedia: Derbyshire's interpretation of Grainer's theme used electronic oscillators and magnetic audio tape editing (including tape loops and reverse tape effects) to create an eerie and unearthly sound that was quite unlike anything that had been heard before. Derbyshire's original Doctor Who theme is one of the first television themes to be created and produced by entirely electronic means. Much of the Doctor Who theme was constructed by recording the individual notes from electronic sources one by one onto magnetic tape, cutting the tape with a razor blade to get individual notes on little pieces of tape a few centimetres long and sticking all the pieces of tape back together one by one to make up the tune. This was a laborious process which took weeks.

From her web site: A recent Guardian article called her 'the unsung heroine of British electronic music', probably because of the way her infectious enthusiasm subtly cross-pollinated the minds of many creative people. She had exploratory encounters with Paul McCartney, Karlheinz Stockhausen, George Martin, Pink Floyd, Brian Jones, Anthony Newley, Ringo Starr and Harry Nilsson.

Monday, November 9, 2009

Solomon Burke-- None of Us Are Free


Jazz organ: great instrument, or the greatest instrument?

Monday, October 12, 2009

Vladislav Delay -- Lumi


Good stuff. The video reminds me a bit of David ORielly's work, I like how the old mechanical quirks of early CG (flickering landscapes, stark textures, rigid movement, low polygon counts) are now being used aesthetically-- like impressionist painters intentionally using visible brush strokes, turning a flaw of their medium into a feature of their work.

Sunday, October 4, 2009

Rite of Spring

On a bit of a modernism kick; really such interesting stuff. Quoth Peter Childs (from wikipedia), "There were paradoxical if not opposed trends towards revolutionary and reactionary positions, fear of the new and delight at the disappearance of the old, nihilism and fanatical enthusiasm, creativity and despair." Or as Fitzgerald put it (at 23, goddamn I feel like an underachiever now), a generation "grown up to find all Gods dead, all wars fought, all faiths in man shaken."

So anyway, here's the Rite of Spring:


And here's a snip of a documentary on the music.

Wednesday, September 2, 2009

Lau Nau: Painovoimaa, valoa

I've got a couple posts brewing on augmented reality and architecture and modeling, but the days have been just packed lately. So here's this instead:

Saturday, August 29, 2009

Basin Street Blues


Kid Koala's cover of Basin Street Blues, by way of Constant Siege. Really love the underwater feel of the animations, it goes well with the song.

Saturday, July 4, 2009

Spectrogram to Sound

I'm still vaguely searching for a good free spectrogram-to-sound program, but this Sound to Graph to Sound Java applet is a good start.

The default resolution is pretty low, but if you're not interested in any of their demo sounds and just feel like doodling, you can hit the reset button to adjust some of the parameters. You can increase the resolution to MxN = 448x448, and to get the frequency bounds closer to vocal range I'd set FL to 10, keeping FH at 4000 (or possibly changing to 8000). You can also increase the value of NFRAME, which lets you store multiple sounds which you can navigate through with the arrow keys, or check the animate box to play them in sequence.

Mostly so far I have succeeded in making lots of drawings that all sound like frogs. Curious.

Tuesday, May 26, 2009

Morgenrot

Wednesday, May 6, 2009

Visualizing Music and Looking for Patterns


Found this and many other impressive videos on one Stephen Malinowski's YouTube channel. I really like the way the colored bar visualization separates out the different voices in a piece, especially the fugues.

The opening to Gödel, Escher, Bach has a fun discussion on the structure of the fugue-- the gist of it is that the composer develops the piece out of one short theme (a few measures of some simple melody), carried by a fixed number of voices. Starting with one voice expressing the theme, each additional voice chimes in repeating the theme until all are present. The theme is further explored and varied throughout the piece via transformations of the original melody: inverting, reversing, transposing, compressing. Soooo the video above is really cool, because the visualizations make it that much easier to pick out all the transformations that are taking place. Yay!

I wonder if you could make other visualization methods which help you pick out recurring themes in a piece, and are robust to transformations from the original theme (or measure distance from the original). It seems like a problem that crops up a lot, in problems from network analysis to predicting structural motifs in proteins. For instance, all integral membrane proteins will have a hydrophobic region which crosses the lipid bilayer-- this requires an extended sequence of hydrophobic amino acids, which will be reflected in the genetic code. There would be variation in sequence (not all membrane proteins would have the same arrangement of hydrophobic amino acids), but there might still be trends which might be picked up. Fourier/Laplace transforms can break a signal down into its periodic components; is there some way to transform a signal to visualize it in the space of its recurrent themes and their variations?

Sunday, April 19, 2009

The Amen Break

Okay okay, I couldn't resist grabbing this as well-- again via the Worldwide Cultural Gonzo Squad, an oddly captivating video on the Amen Break, a six-second-long drum loop from the b-side of a 1969 single which was taken up by early sample-based music and is now the basis for entire musical subgenres, as well as every advertisement soundtrack ever. Also interesting for its discussion of copyright law, and the fact that it's narrated by a surprisingly realistic electronic voice.

Saturday, April 18, 2009

Sound to Pixels


Found a nifty article about a piece of digital music software called Photosounder, posted on a blog called 
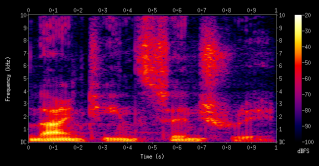
Create Digital Music. Photosounder is an image-sound editing program-- that is, music creation is done visually, by drawing and editing the sound's spectrogram. The videos in the CDM article show some of the ways in which this software is being used; it's pretty impressive stuff. I also found this plugin for winamp which produces a simple spectrogram of your music as a visualization, if you're just curious to see what the music you're listening to would look like.

The spectrogram is actually a good representation of how sound is coded in the brain-- the cochlea in your ear breaks down sound input into narrow frequency bands, just as we see on the X axis of the spectrogram, and cells in each frequency band fire in proportion with the intensity of sound at that frequency (so, you have a physical structure in your ear which performs a Fourier transform-- how cool is that?) As seen in this video, a single sound object usually consists of several harmonics, and a full spectrogram can be quite complex-- and yet our brain can easily segment that spectrogram to identify different instruments, even when there's a lot of frequency overlap. We are even able to focus our attention on one specific instrument, which means selectively responding to one particular batch of signals as they move up and down across frequency channels/cell populations. Brains are pretty awesome, guys.

(And on another note: as you can see in the aforelinked video, one of the easiest ways to pick out one instrument from a spectrogram is to look for elements which "move together" in time/across the spectrum-- this notion drives a lot of work in both auditory processing and the corresponding problem of object recognition in computer vision.)